Agent Dashboard
The Dashboard is your home screen when you log in. It provides a snapshot of your performance and quick access to key actions.
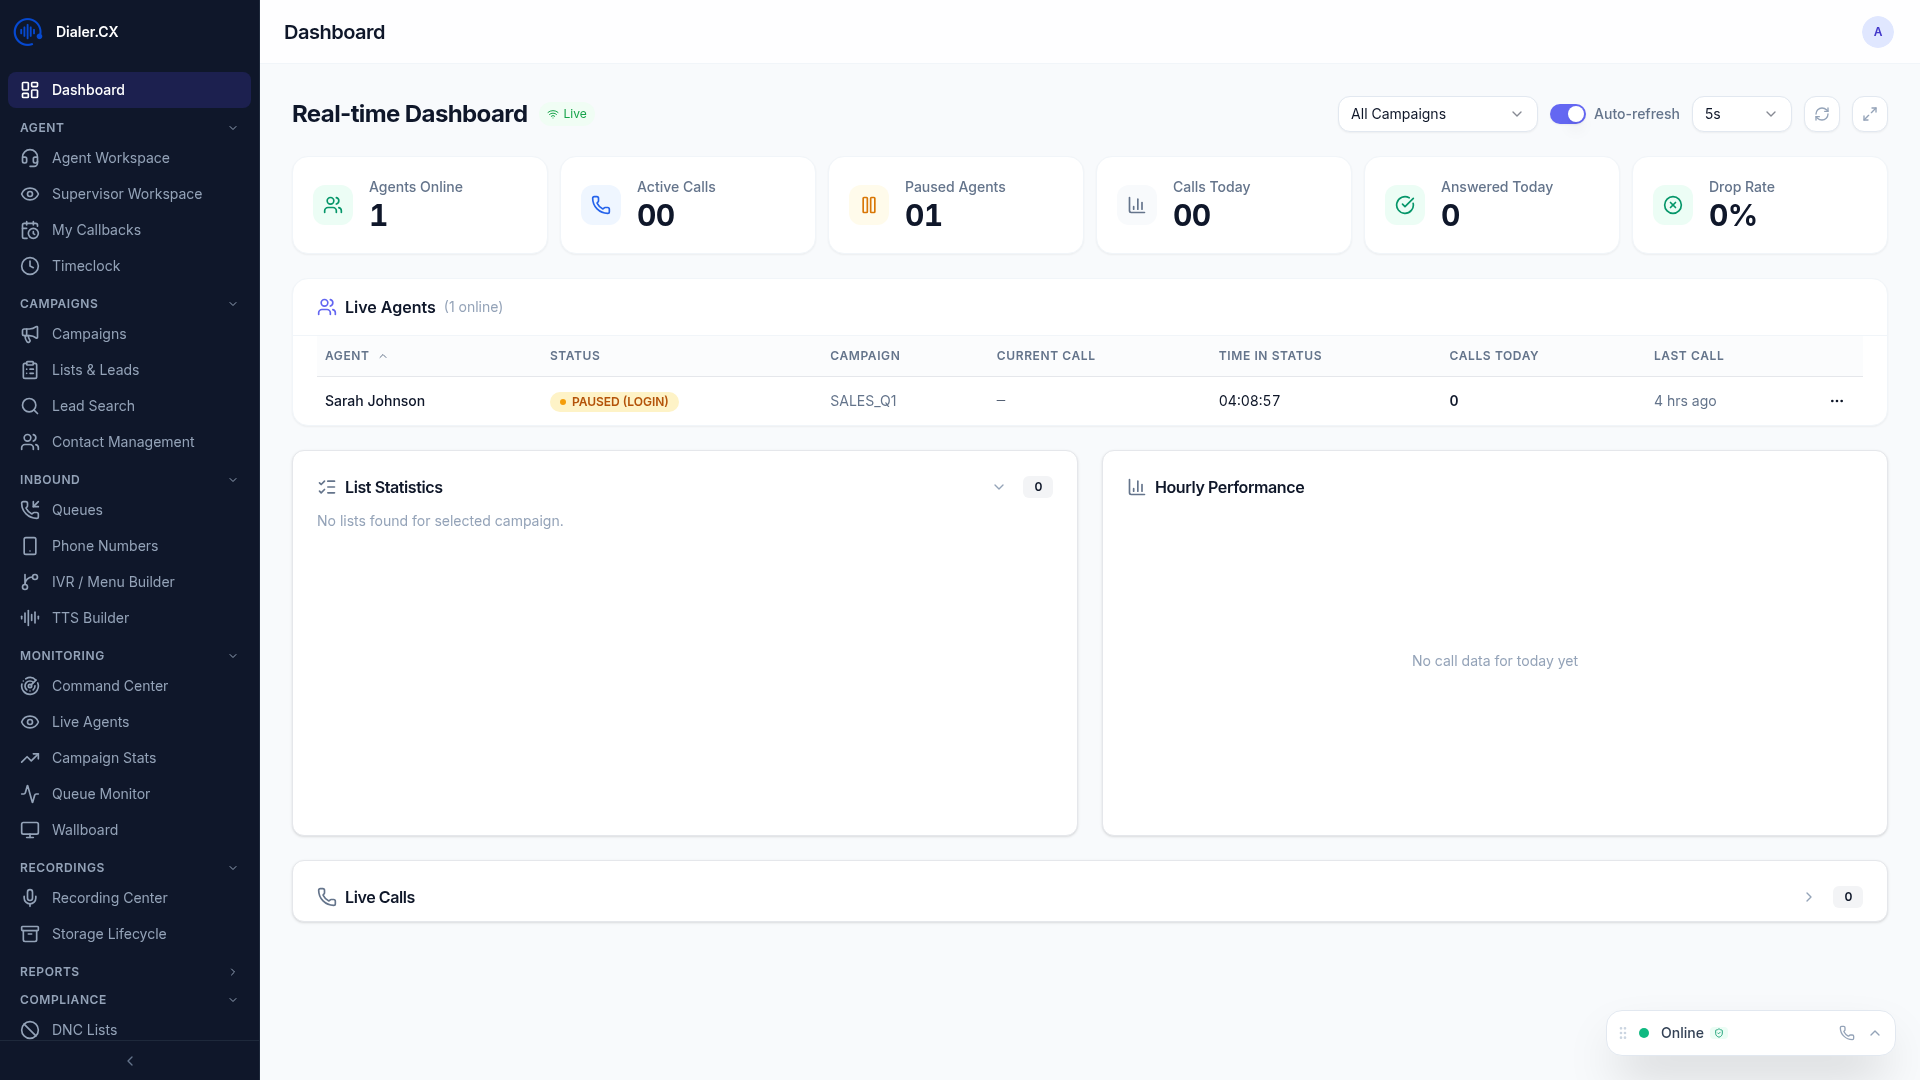
Performance Metrics
Section titled “Performance Metrics”Your dashboard shows today’s key numbers:
| Metric | Description |
|---|---|
| Calls Today | Total calls handled in your current session |
| Talk Time | Cumulative time spent on calls |
| Pause Time | Cumulative time spent on breaks |
| Login Duration | How long you’ve been logged in |
| Conversion Rate | Percentage of calls resulting in a sale (if applicable) |
Quick Actions
Section titled “Quick Actions”- Go to Workspace — jump to the Agent Workspace to start taking calls
- View Callbacks — see your scheduled follow-up calls
- Search Leads — find a specific contact by phone number or name
Dashboard Header
Section titled “Dashboard Header”The header bar displays your name, role, and current session information at a glance. It also provides direct access to logout and system notifications.

Recent Activity
Section titled “Recent Activity”A feed of your most recent calls showing:
- Lead name and phone number
- Call duration
- Disposition applied
- Timestamp
Campaign Status
Section titled “Campaign Status”If you’re logged into a campaign, the dashboard shows:
- Campaign name and dial mode
- Number of agents currently logged in
- Queue depth (calls waiting)
- Your position in the agent rotation
Full Dashboard View
Section titled “Full Dashboard View”The complete dashboard layout combines all panels — metrics, activity feed, campaign status, and announcements — into a single scrollable view.

System Announcements
Section titled “System Announcements”Administrators can post announcements visible on all agent dashboards — important notices, schedule changes, or campaign updates.