Alerts
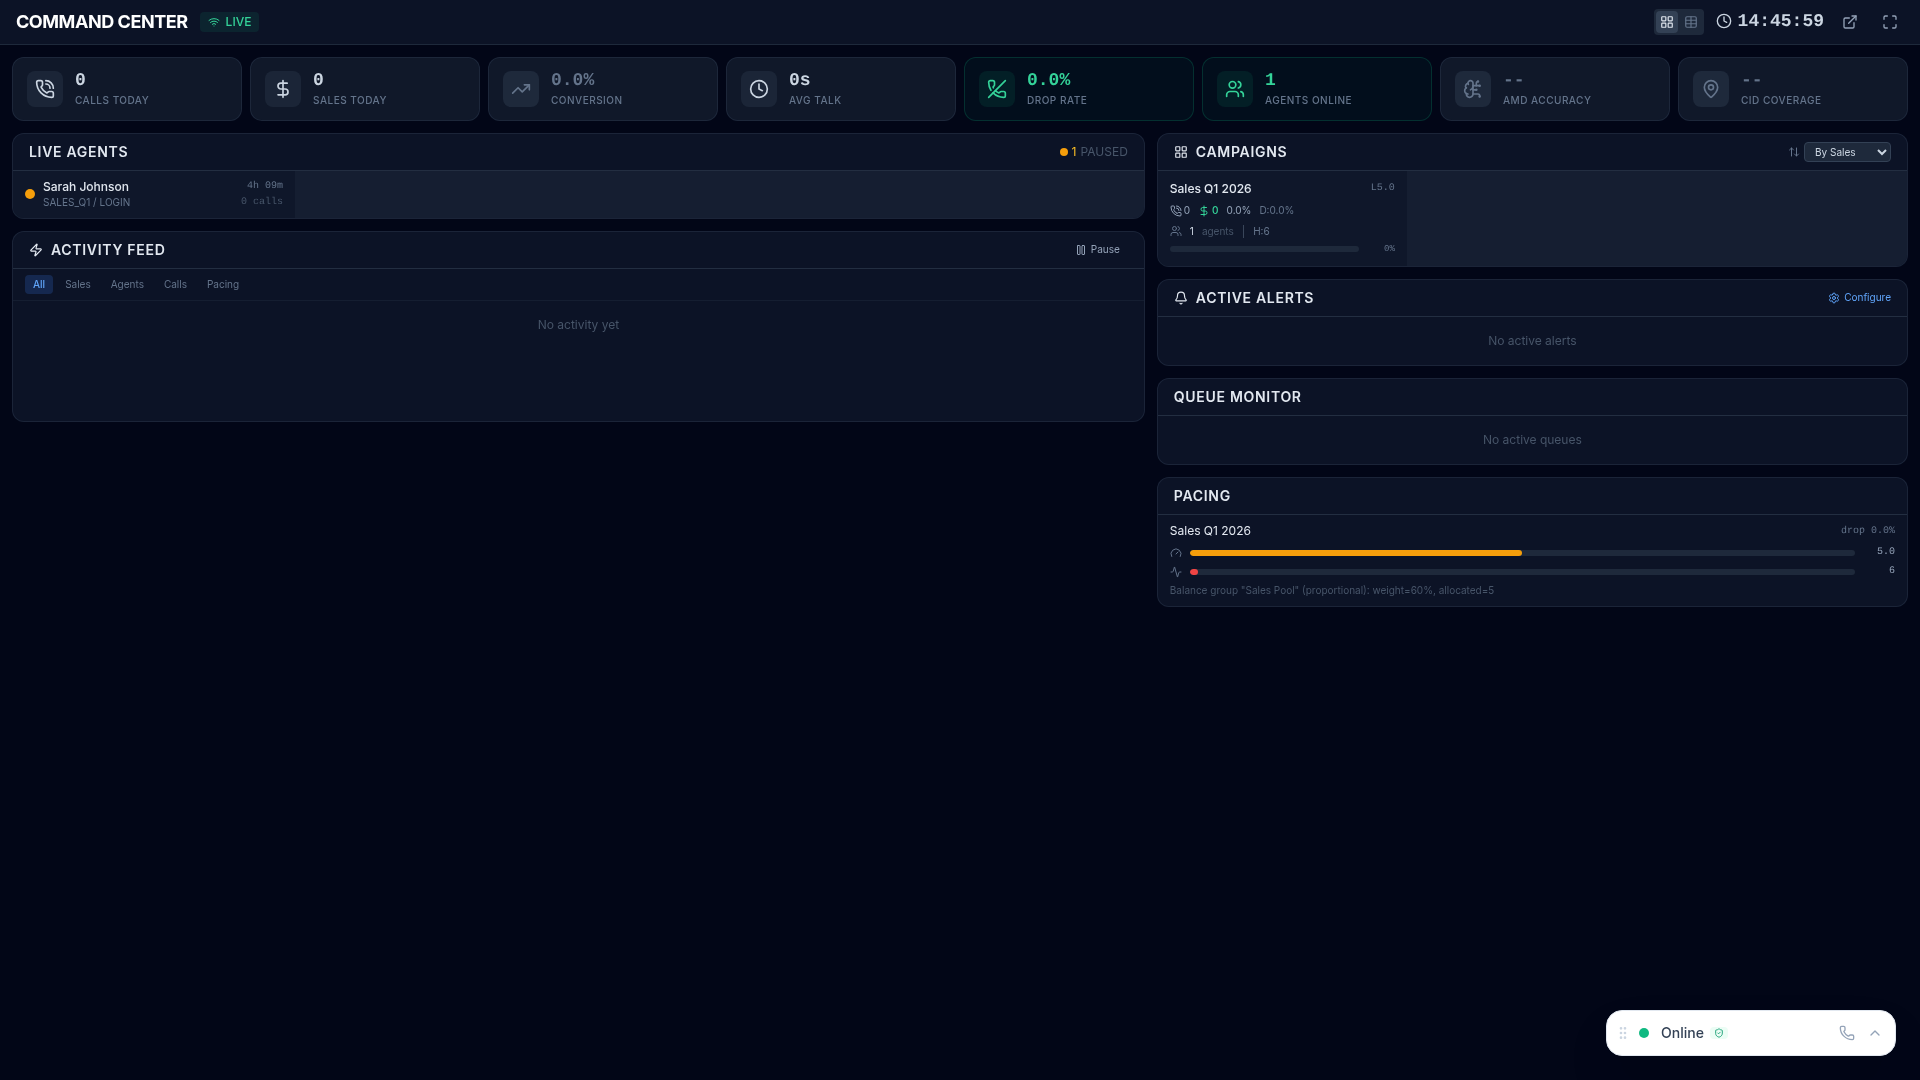
Alerts automatically notify you when operational metrics cross defined thresholds, enabling fast response to issues before they impact service levels or agent productivity. Triggered alerts surface in the Command Center and can be delivered via email and webhooks.
Creating Alert Rules
Section titled “Creating Alert Rules”- Navigate to alert configuration in the platform
- Click New Rule
- Configure the rule parameters:
| Setting | Description |
|---|---|
| Name | Descriptive name for this rule (e.g., “Queue Overflow Warning”) |
| Metric | What to monitor (queue depth, wait time, drop rate, agent count, etc.) |
| Condition | Greater than, less than, equals, or percentage change |
| Threshold | The trigger value that fires the alert |
| Campaign | Which campaign to monitor (or all campaigns) |
| Channels | How to be notified: in-app, email, webhook |
Notification Channels
Section titled “Notification Channels”| Channel | Description | Best For |
|---|---|---|
| In-App | Alert banner displayed in the platform UI and Command Center | Supervisors actively using the platform |
| Alert details sent to configured recipients via SMTP | Off-floor managers and escalation contacts | |
| Webhook | HTTP POST to your external systems (Slack, PagerDuty, etc.) | Integration with existing incident management |
Alert Lifecycle
Section titled “Alert Lifecycle”Each alert follows a four-stage lifecycle:
- Triggered — metric crosses the defined threshold, notifications fire
- Active — alert is visible in the platform and awaiting response
- Acknowledged — supervisor marks as seen with optional notes explaining the situation
- Resolved — condition returns to normal automatically, or a supervisor manually resolves it
The full lifecycle is tracked in Alert History for post-incident review.
Alert History
Section titled “Alert History”View all past alerts with complete audit trail:
- When triggered and resolved — exact timestamps and duration
- Who acknowledged and when — accountability for response times
- Which metric and threshold — full rule details for context
- Frequency analysis — how often each rule triggers, identifying recurring issues

Example Rules
Section titled “Example Rules”Common alert configurations to get started:
| Rule | Trigger | Severity |
|---|---|---|
| Queue overflow | Queue depth > 20 calls | Critical |
| Long wait time | Average wait > 3 minutes | Warning |
| High drop rate | Abandon rate > 5% | Critical |
| Low agent count | Available agents < 3 | Warning |
| Service level breach | Service level < 80% | Critical |
| High pause time | Average pause > 15 minutes | Warning |