Custom Report Builder
The Custom Report Builder lets you create tailored reports without any technical knowledge. Instead of being limited to the 14 standard reports, you can combine any metrics, groupings, and visualizations to answer specific business questions.
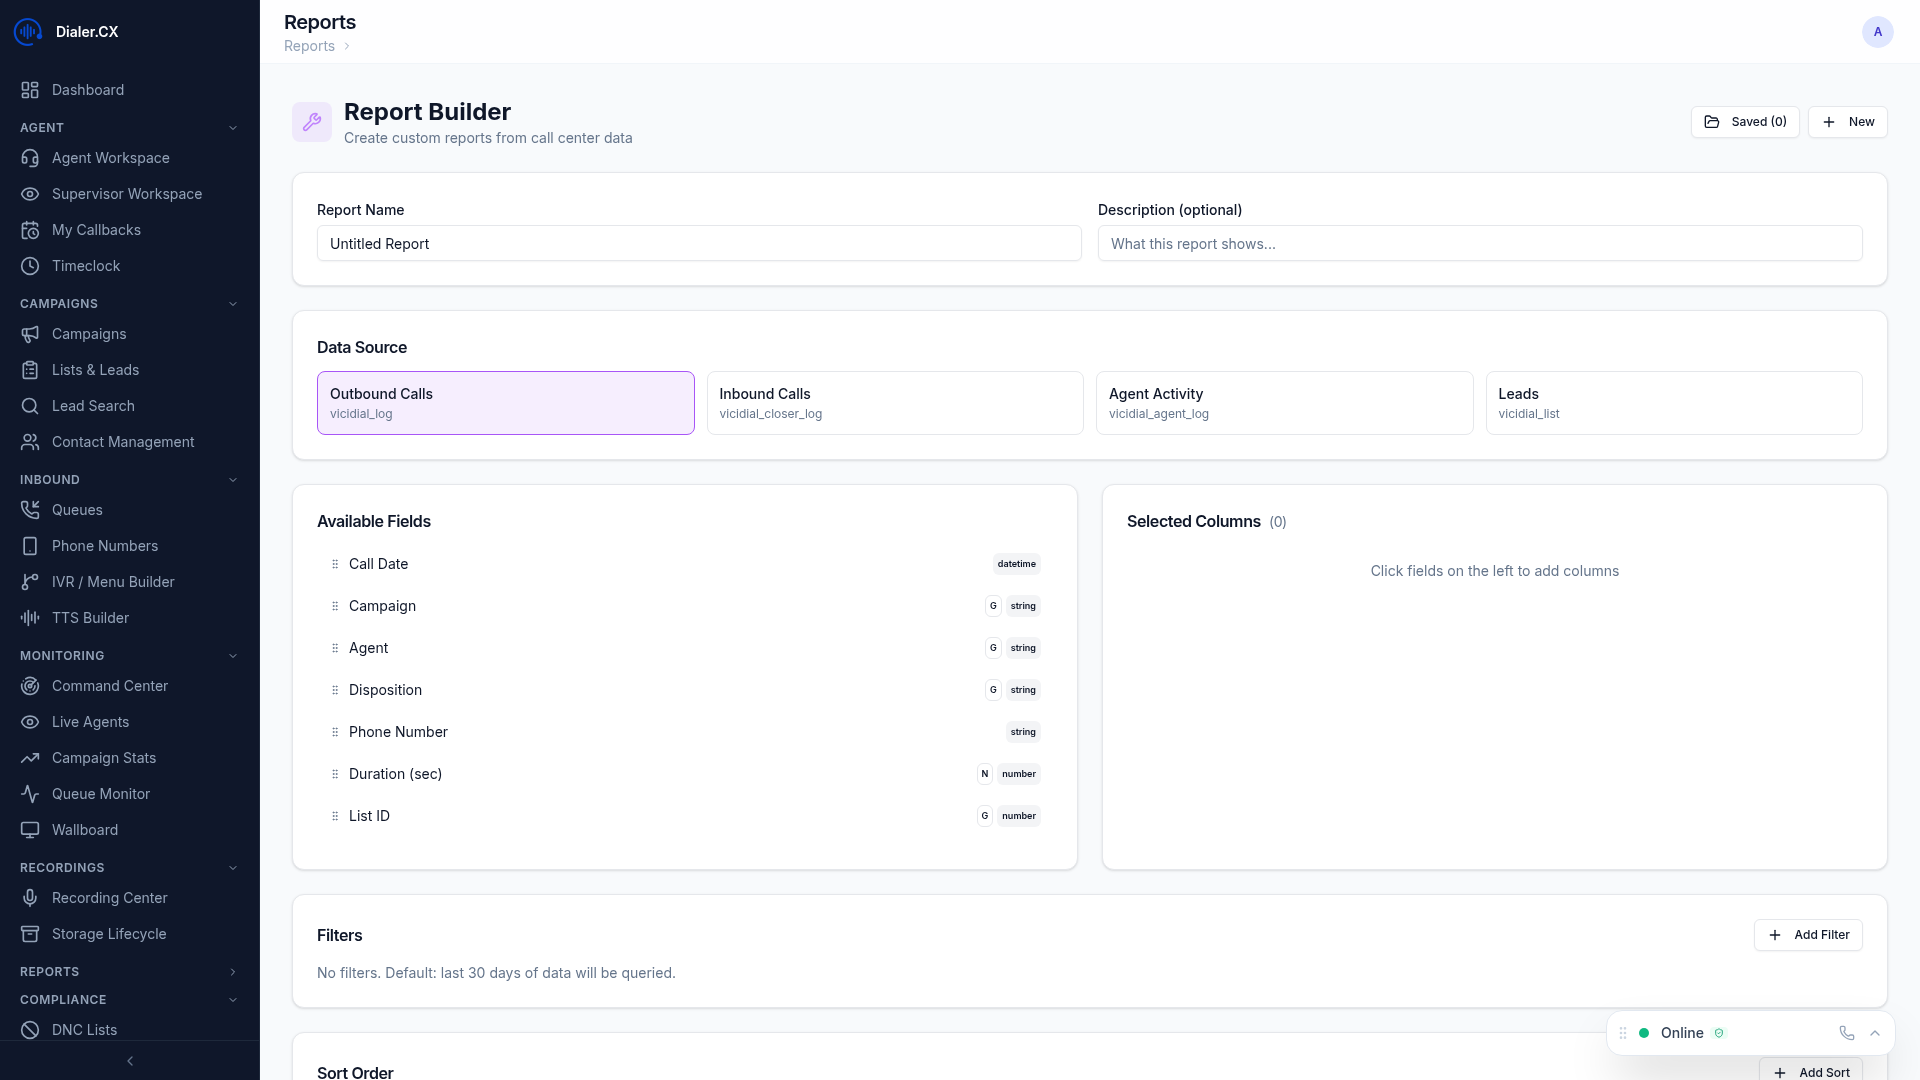
Building a Report
Section titled “Building a Report”- Navigate to Reports > Builder
- Click New Report
- Select metrics — drag desired data points onto the canvas from the metric library
- Choose grouping — group by agent, campaign, list, date, hour, or disposition
- Add filters — narrow the data scope to specific campaigns, date ranges, or agent groups
- Pick visualization — table, bar chart, line chart, pie chart, or area chart
- Preview — see the report rendered with live data before saving
- Save — name your report for future use
Calculated Fields
Section titled “Calculated Fields”Create derived metrics using simple formulas:
- Conversion Rate = Sales / Contacts
- Average Handle Time = (Talk Time + Dispo Time) / Calls
- Revenue Per Call = Total Revenue / Total Calls
- Define your own formulas using any combination of available metrics
Calculated fields update dynamically as the underlying data changes, so your custom ratios and percentages are always current.
Saved Views
Section titled “Saved Views”Bookmark specific filter and grouping combinations for quick access:
- Save a view for “This Week’s Sales Team Performance” with all the right filters pre-applied
- Switch between saved views instantly using the dropdown at the top of the builder
- Share views with other users who have the appropriate role access
Saved views persist across sessions and are available whenever you return to the report builder.
Sharing and Access
Section titled “Sharing and Access”- Saved reports are visible to users with appropriate role access (Supervisor and above)
- Export any custom report to CSV for use in external tools like Excel or Google Sheets
- Schedule custom reports for automated email delivery (see Scheduled Reports)
Visualization Options
Section titled “Visualization Options”| Type | Best For |
|---|---|
| Table | Detailed data with sorting and pagination — ideal for CDR-style drill-downs |
| Bar Chart | Comparing values across categories (e.g., sales by campaign) |
| Line Chart | Trends over time (e.g., daily contact rate over a month) |
| Pie Chart | Proportional distribution (e.g., disposition breakdown) |
| Area Chart | Volume and trends combined (e.g., call volume with trend overlay) |
Example Use Cases
Section titled “Example Use Cases”Here are some custom reports that operations teams commonly build:
- “Hourly Conversion Heatmap” — Conversion rate grouped by hour and day of week, displayed as a table with color coding
- “List ROI Tracker” — Revenue per sale multiplied by conversions, grouped by lead list, displayed as a bar chart
- “Agent Ramp Report” — New agent performance over their first 30 days, grouped by agent and week, displayed as a line chart
- “Disposition Audit” — All dispositions grouped by agent, used to spot agents who may be miscoding calls