Live Monitoring
The Monitoring section gives supervisors real-time visibility into all call center operations with live-streaming data that updates automatically. Three dedicated views — Agents, Campaigns, and Queues — let you drill into every layer of your operation without refreshing the page.

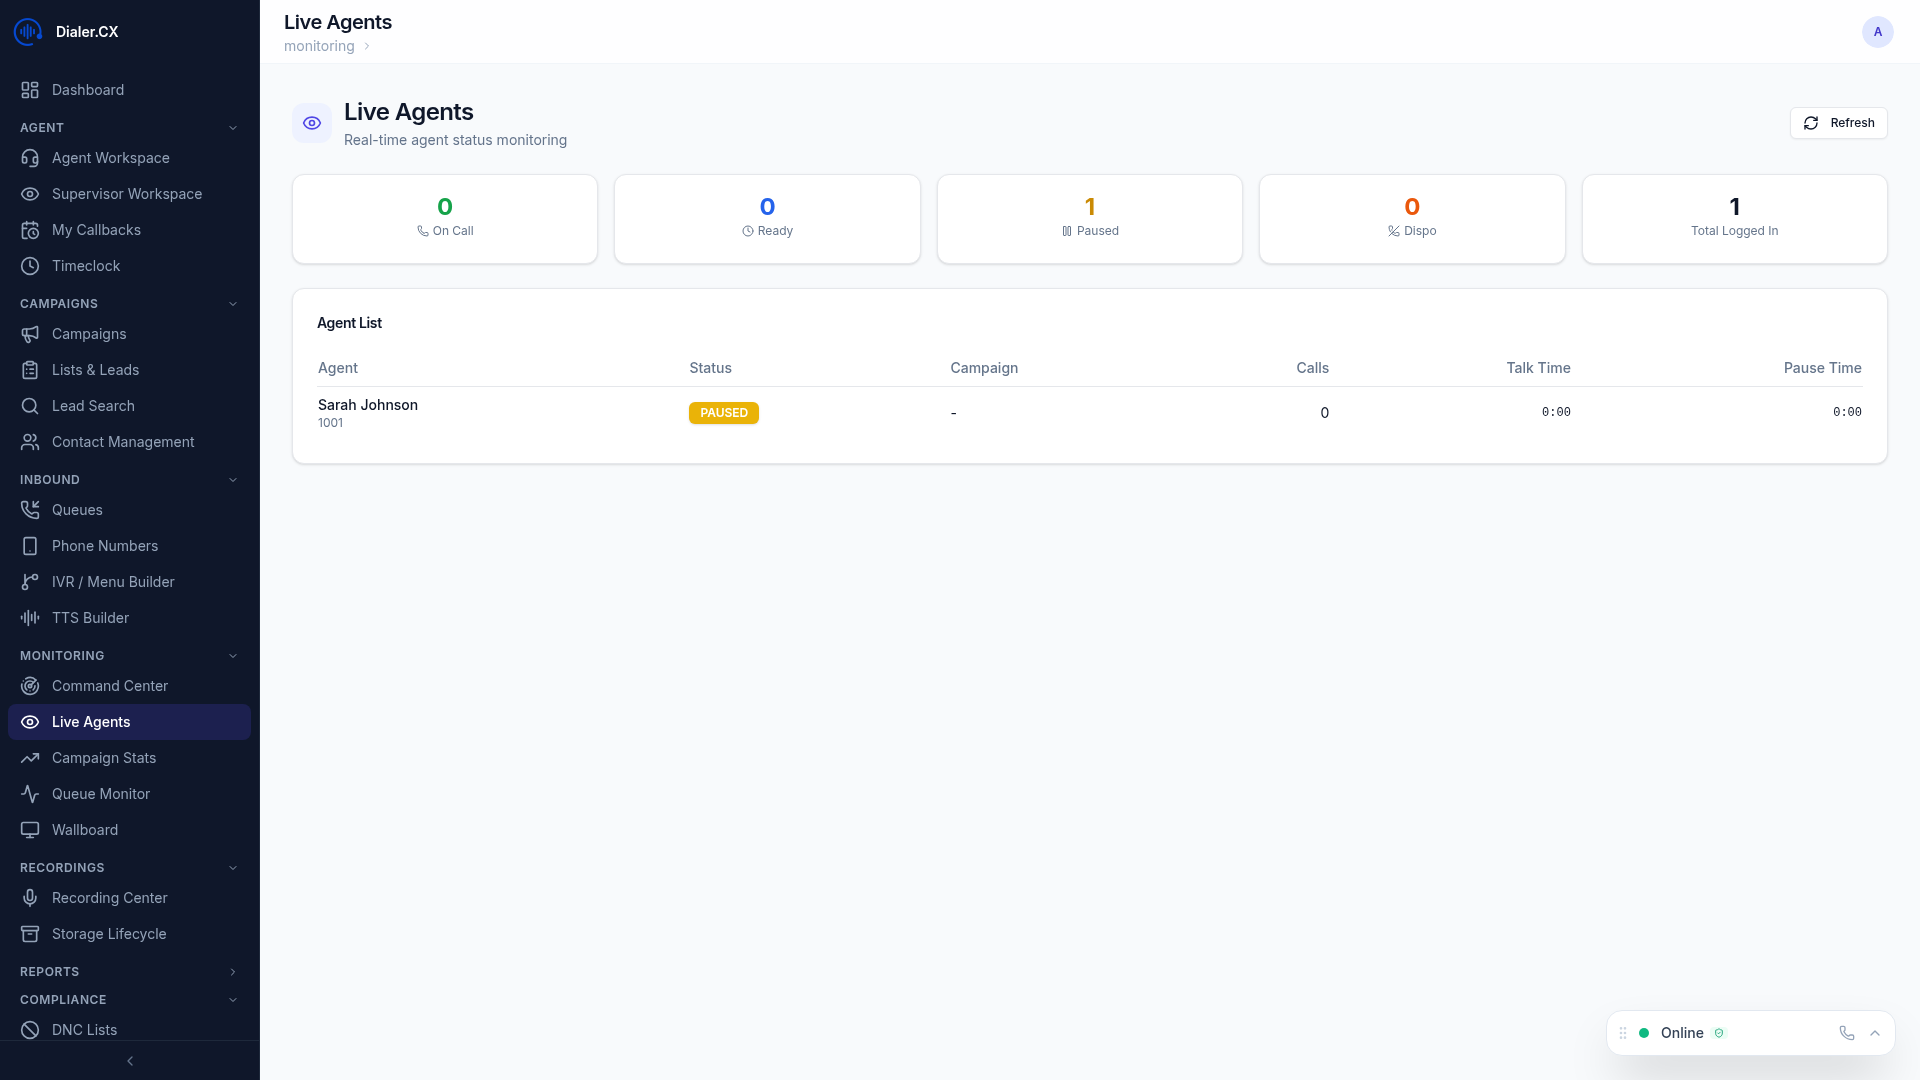
Agent Monitoring
Section titled “Agent Monitoring”The agent monitor is your primary tool for understanding what every agent is doing right now. Each row updates in real time as agents move between states.
| Column | Description |
|---|---|
| Agent | Name and username |
| Status | Current state (Ready, In Call, Paused, Dispo) — color-coded |
| Campaign | Assigned campaign |
| Current Call | Lead name, phone number, and duration |
| Calls Today | Total calls handled |
| Talk Time | Cumulative talk time |
| Pause Time | Time spent on breaks |
| Pause Code | Current break reason (if paused) |
Supervisor Actions
Section titled “Supervisor Actions”Click on any agent to take action:
| Action | Description |
|---|---|
| Listen | Silently monitor an agent’s call |
| Whisper | Speak to the agent without the customer hearing |
| Barge | Join the call as a three-way participant |
| Force Pause | Remotely pause an agent |
| Force Logout | Remotely log out an agent |
Campaign Monitoring
Section titled “Campaign Monitoring”The campaign monitor shows real-time performance for every active campaign on a single screen.
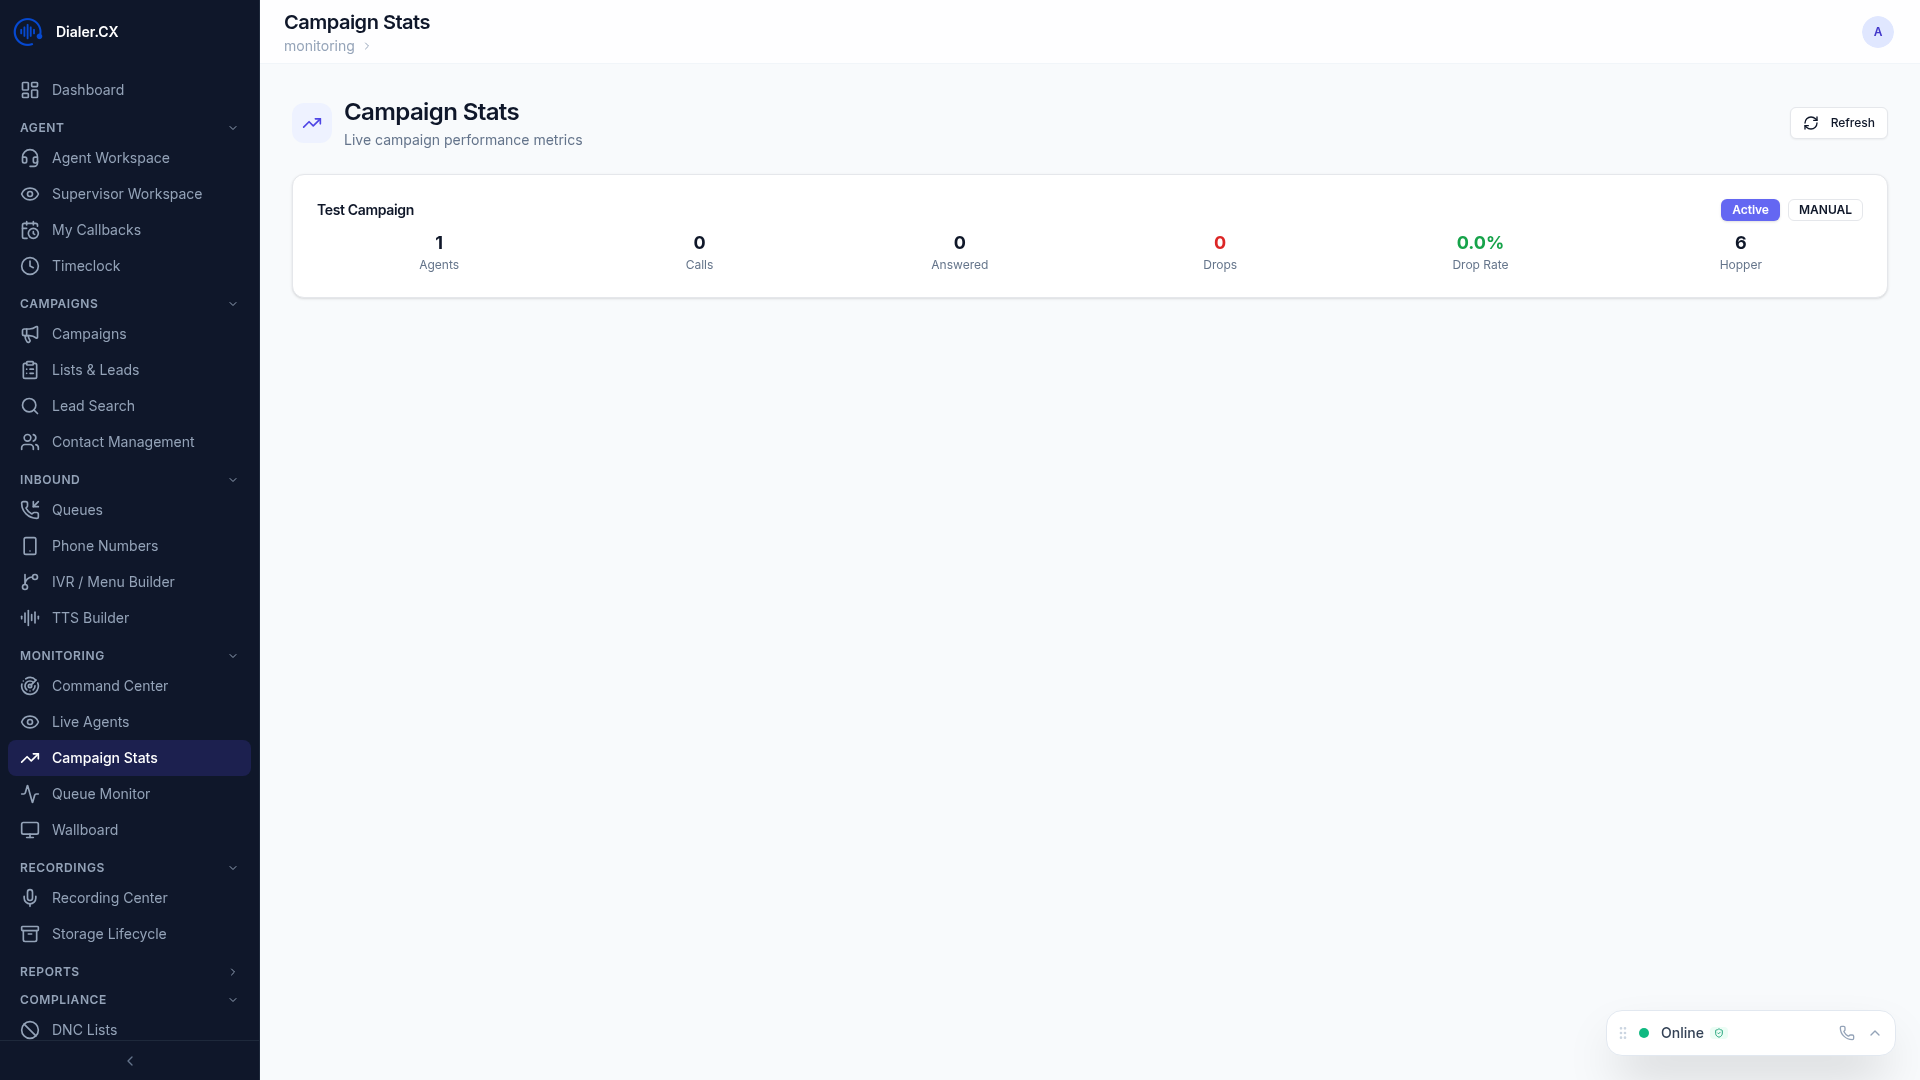
Key metrics displayed:
- Active campaigns with live agent counts
- Queue depth — calls waiting to be answered
- Dial level — current pacing
- Answer rate — live answer percentage
- Drop rate — abandoned call percentage
- Agent utilization — time talking vs. waiting

Queue Monitoring
Section titled “Queue Monitoring”The queue monitor provides visibility into inbound call queues, helping you spot bottlenecks before hold times become unacceptable.
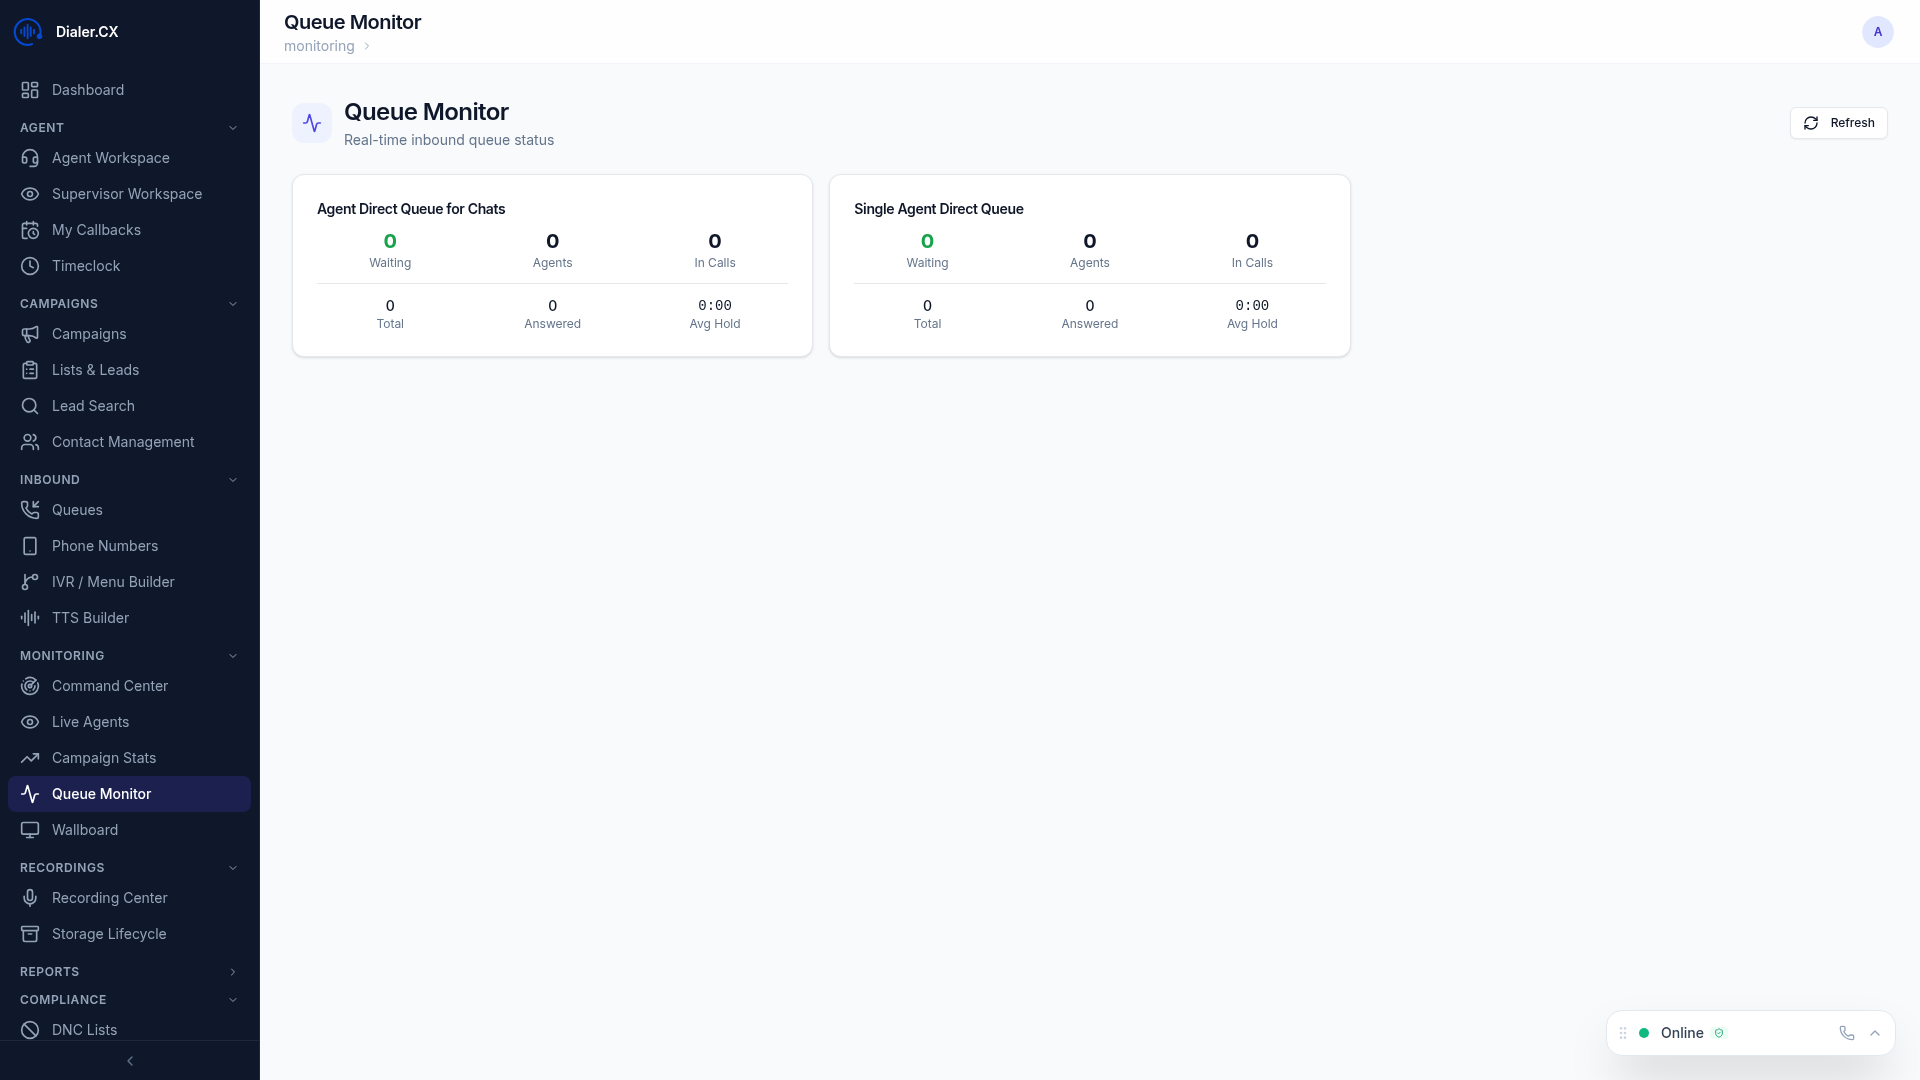
Key metrics displayed:
- Queue depth per queue
- Wait times — average and maximum
- Agents available per queue
- Service level tracking
- Calls in queue with hold duration

Real-Time Updates
Section titled “Real-Time Updates”All monitoring screens update automatically using Server-Sent Events (SSE) — no page refreshes needed. Data streams directly from the server to your browser, ensuring you always see the current state of operations.
The monitoring views are also available on the Command Center and Wallboard for NOC and TV display use cases.